




If you run a local business and you came here looking for one clean average marketing budget by industry, I have to be straight with you. There isn’t one. Two well-known surveys put the overall average near 8% to 9% of annual revenue in 2026, but they asked different companies, and the industry figures underneath them differ for a reason.
This article is for owners who want industry benchmarks they can actually trust. I’ll walk through a sourced table of marketing spend by industry, as a percentage of revenue, with the source and the year on every row, then why budgets vary and how to use those marketing spend benchmarks without copying them. If you want the deep dive on how much small businesses should spend on marketing, I already wrote that in how much a small business should spend on marketing. This post is the industry table.
The short answer: the average marketing budget as a percent of revenue
Gartner’s 2026 CMO Spend Survey put average marketing budgets at 7.8% of revenue, up slightly from 7.7% in 2025. Gartner called that effectively flat, and 18% lower than the mean of four years earlier. The survey ran January through March 2026 among 401 CMOs and other marketing leaders in North America, the United Kingdom, and Europe, with the vast majority at companies reporting more than $1 billion in annual revenue. Findings were published on May 11, 2026. The 2025 edition (402 respondents) reported a 7.7% mean and a 6.0% median. I did not find a public 2026 median.
The CMO Survey, run by Duke University’s Fuqua School of Business and co-sponsored by Deloitte and the American Marketing Association, landed higher on the mean and lower on the typical company. Marketing expenses averaged 8.96% of company revenues (the Highlights report rounds that to 9.0%) and 9.6% of overall company budgets. The median was 5%. Heavier spenders pull the average up, so the typical company in that sample sits well below the mean. The revenue question was answered by 154 of 308 marketing leaders at for-profit U.S. companies, 97% of them VP-level or higher. The survey ran January 7 to January 29, 2026. Overall marketing spending grew only 1.7% over the prior 12 months, the weakest rate since 2021, while digital marketing spending grew 8.2%.
Those are marketing spend benchmarks, not a recommended total marketing budget for your business. Gartner is largely an enterprise sample. Most marketing leaders in that survey work at enterprise organizations. The CMO Survey covers a broader mix of company sizes, and smaller firms in that sample spend a higher share of revenue on marketing. A local business that copies 7.8% because “that is the industry average” is using the wrong reference.
Overall marketing budget benchmarks at a glance
| What was measured | Figure | Source and date |
|---|---|---|
| Mean marketing budget as % of company revenue | 7.8% | Gartner 2026 CMO Spend Survey, 401 leaders, mostly $1B+; May 11, 2026 |
| Same measure, prior year | 7.7% (median 6.0%; 25th 4.0%; 75th 10.5%) | Gartner 2025 CMO Spend Survey, 402 leaders; May 12, 2025 |
| Mean as % of company revenues | 8.96% (9.0% in the Highlights) | The CMO Survey 2026, fielded Jan 7 to 29 |
| Median as % of company revenues | 5% | The CMO Survey 2026 Topline, 154 answers |
| Mean as % of the company’s overall budget | 9.64% (9.6% in the Highlights) | The CMO Survey 2026, 146 answers |
Marketing budget by industry: the 2026 table
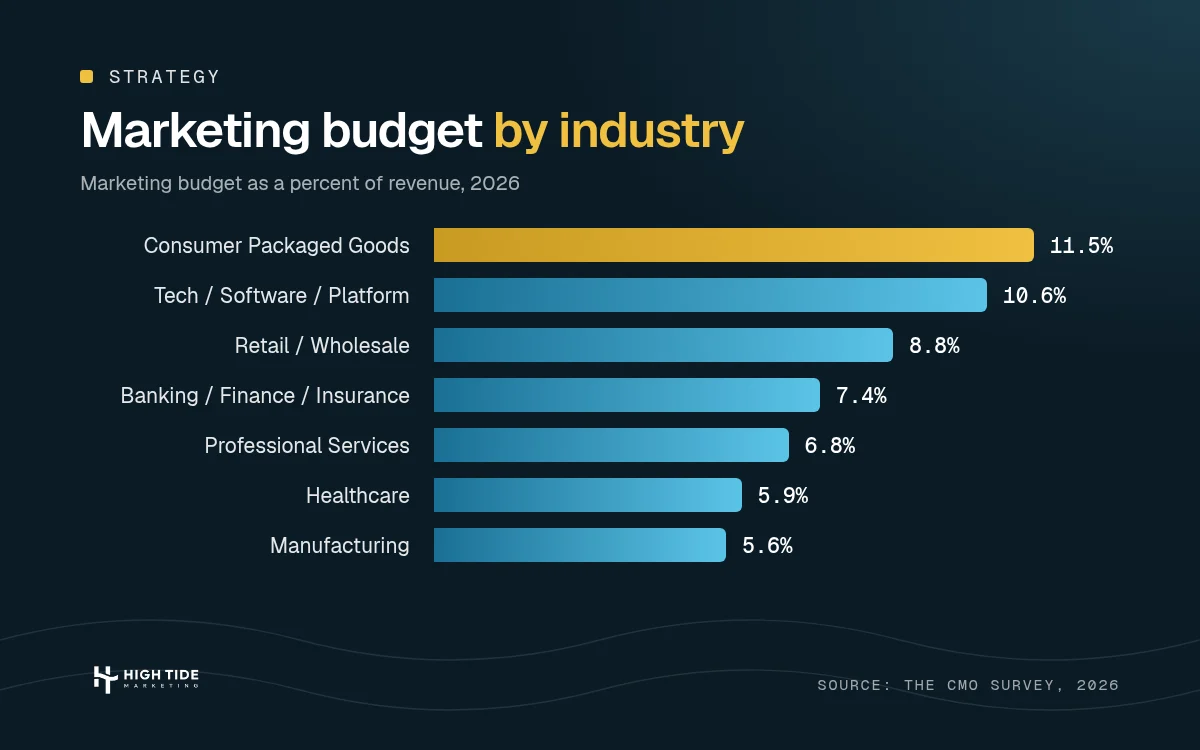
The cleanest public industry breakdown I can point you to is The CMO Survey’s 2026 Firm and Industry Breakout Report. The question is: “Marketing expenses account for what percent of your company’s revenues?” The figures are means, for sectors with at least 10 responses, rounded to one decimal. Exact means, sample sizes, and standard deviations are in the Sources section.
| Industry (CMO Survey label) | % of revenue (mean) | n | Source | Year |
|---|---|---|---|---|
| Consumer Packaged Goods | 11.5% | 15 | The CMO Survey Breakout Report | 2026 |
| Tech / Software / Platform | 10.6% | 33 | The CMO Survey | 2026 |
| Retail / Wholesale | 8.8% | 10 | The CMO Survey | 2026 |
| Banking / Finance / Insurance | 7.4% | 21 | The CMO Survey | 2026 |
| Professional Services | 6.8% | 12 | The CMO Survey | 2026 |
| Healthcare | 5.9% | 17 | The CMO Survey | 2026 |
| Manufacturing | 5.6% | 13 | The CMO Survey | 2026 |
Consumer Packaged Goods and Tech / Software / Platform spend the most as a share of revenue. Healthcare marketing and Manufacturing sit at the low end, both near 5.9% and 5.6%. Some rows still rest on 10 to 15 companies, and the standard deviations are often as big as the mean. A one-point gap is not a plan.
I left out sectors with fewer than 10 responses, including Education (18.4%, n=5) and Communications / Media (18.0%, n=6). The Highlights report flagged Education as a top sector. That is the same five-company cell, with a standard deviation of 19.31, so I would not treat it as a stable average. The other small-sample sectors are listed in the Sources section.
A second industry view, from a different sample (2025, older)
Gartner has not published a public industry table for the 2026 survey in the May 11 press release or the June 25, 2026 article I reviewed. It did publish one for 2025, in The Chief Marketing Officer journal (3Q 2025, PDF dated July 16, 2025), Figure 3, as a share of total revenue. This is a mostly enterprise sample, with different industry labels. I am showing it as a separate, older view, not as a column you can merge with the 2026 table.
| Industry (Gartner label) | % of revenue (mean) | n | Source | Year |
|---|---|---|---|---|
| Consumer products | 9.7% | 43 | Gartner CMO Spend Survey, CMO Journal 3Q 2025, Figure 3 | 2025 |
| Manufacturing | 9.5% | 52 | Gartner, same figure | 2025 |
| Pharma | 9.0% | 32 | Gartner, same figure | 2025 |
| Media | 8.0% | 31 | Gartner, same figure | 2025 |
| Insurance | 7.5% | 43 | Gartner, same figure | 2025 |
| Financial services | 7.2% | 50 | Gartner, same figure | 2025 |
| Retail | 7.1% | 36 | Gartner, same figure | 2025 |
| Travel and hospitality | 6.7% | 37 | Gartner, same figure | 2025 |
| Healthcare | 5.9% | 42 | Gartner, same figure | 2025 |
| IT and business services | 5.8% | 36 | Gartner, same figure | 2025 |
The two sources can disagree, and that is the point. Manufacturing is 5.6% in The CMO Survey’s 2026 sample (n=13) and 9.5% in Gartner’s 2025 enterprise sample (n=52). Healthcare is close (5.9% in both). Tech / Software / Platform is 10.6% in The CMO Survey, while Gartner’s “IT and business services” is 5.8%. Different labels, different years, and different company sizes. If a blog mashes them into one “2026” column, it is not giving you a real benchmark.
Why marketing budgets vary: company size, growth stage, and margins
An industry average is a midpoint from one sample. Your number moves with margins, growth stage, company size, business model, and how long it takes to win a customer.
Margins. The percentage is a share of revenue, not a share of profit. If 8% of revenue would wipe out the year, the benchmark is not “wrong.” It is not your number.
Company size. In The CMO Survey’s 2026 breakout, companies under $10 million in sales revenue reported a mean of 13.3% of revenue (n=20). The $10 million to $25 million band was 17.4% (n=15). The $1 billion to $9.9 billion band was 5.7% (n=33). Those cells are not huge, but the direction matches the Highlights report: smaller companies spend a larger share, and larger companies spend less as a percentage of revenue. The same website, team, and tools take a bigger bite when annual revenue is smaller.
Growth stage. Early stage businesses trying to get early traction usually need a higher share than mature businesses protecting a known book of work. I am not going to invent a percentage for early stage companies. For a way to match marketing dollars to a growth goal, use the small-business marketing spend article.
Sales cycle, competition, and local versus national. Long sales cycles in B2B marketing often need more time, more content marketing, and more thought leadership than a simple local purchase. A crowded market costs more to be heard in if you want brand visibility. A local business is not in the same competitive set as a national brand, which is why the Gartner average (mostly companies over $1 billion in annual revenue) is easy to misapply.
B2B marketing vs B2C: spend by business model
The CMO Survey also breaks the same revenue question out by primary economic sector, which is cleaner than forcing every industry into “B2B spends less.”
| Business model (CMO Survey label) | % of revenue (mean) | n | Source | Year |
|---|---|---|---|---|
| B2C Product | 12.0% | 34 | The CMO Survey | 2026 |
| B2B Services | 10.1% | 41 | The CMO Survey | 2026 |
| B2C Services | 7.2% | 18 | The CMO Survey | 2026 |
| B2B Product | 7.0% | 61 | The CMO Survey | 2026 |
B2C Product companies spend the most as a share of revenue. Business service companies on the B2B side are not far behind, and they outspend B2C Services in this sample. So “B2B companies spend less than B2C” is only half true. It depends on whether you sell a product or a service, and on how you reach your target audience. For a fuller comparison of how those models go to market, see B2B vs B2C marketing.
How to use an industry average without copying it
An industry average tells you what a defined group of companies reported spending. It does not tell you what you should spend, and it is not the same thing as industry standards you have to meet. Use it as a check in your budget conversation, not as a target.
Start with your goal for the next 12 months, your margins, and what a new customer is worth to you (lifetime value, not a copied customer acquisition cost). Then look at the industry row and the business-model row that actually match how you sell. If you are a small professional services firm, The CMO Survey’s Professional Services mean (6.8%, n=12) and the B2B Services mean (10.1%, n=41) are more relevant than Gartner’s 7.8% figure for larger companies. If the revenue spent in your plan is far outside those bands, ask why.
Then give every dollar a job. A percentage with no plan is just a ceiling. I walked through that idea in how to give every marketing channel a job. Judge your marketing efforts by qualified inquiries, booked work, and collected revenue, not by conversion rates alone, and not by whether you “hit the industry average.” For a practical list of the work that usually sits inside a small-business plan, use the small business marketing checklist. For setting the actual percentage, go back to how much a small business should spend on marketing. That post is the how-to. This one is the table.
Where the money usually goes: paid media and digital channels
Industry tables answer “how much.” They do not answer “on what.” I will only use channel figures I can source.
In its June 25, 2026 article on the 2026 CMO Spend Survey, Gartner said CMOs are shifting spend toward paid media, now 31.4% of marketing budgets, a significant portion of the total budget, funded in part by cuts to agencies. That paid media includes digital advertising and paid ads, such as paid search, search ads, and other paid channels, with more focus on digital marketing and customer acquisition and less on loyalty, retention, and brand investment. In the 2025 survey, paid media was 30.6% of marketing budgets, or 2.4% of revenue. Gartner also reported that CMOs are allocating 15.3% of 2026 marketing budgets to AI initiatives.
The CMO Survey’s 2026 Highlights report said social media spending had rebounded to 14.3% of budgets, after falling in 2025. Marketers predicted 17.1% in one year, but the same report warned that those 12-month projections have consistently exceeded actual spending, by an average of 2.1 percentage points. Traditional advertising was projected to decline a further 1.5% in the coming year. Acquisition budgets were 26.0% larger than retention budgets, and 82.0% of respondents spent more on acquisition than on retention, even as customer retention was the stronger performance metric (12.8% growth, versus 7.4% for acquisition).
None of that is a recommended mix for a local business or for small businesses in general. Paid media at 31.4% of budget is an enterprise CMO figure. Your mix of marketing channels should follow the job of each one: discovery, consideration, or decision. Email marketing, content marketing, trade shows, and in-person events can all be part of how you generate leads or do brand building, but I do not have a sourced share of budget for those, so I will not invent one. If search visibility is a budget line in that mix, typical local SEO cost ranges are in how much local SEO costs.
Frequently asked questions
What is the average marketing budget as a percentage of revenue?
It depends on the sample. Gartner’s 2026 survey, mostly companies over $1 billion, put the mean at 7.8% of company revenue. The CMO Survey’s 2026 U.S. sample put the mean at 8.96% and the median at 5%. Look at both, and at the rows that match you.
Which industries spend the most on marketing?
In The CMO Survey’s 2026 sectors with at least 10 responses, Consumer Packaged Goods (11.5%) and Tech / Software / Platform (10.6%) had the highest means. In Gartner’s 2025 enterprise sample, Consumer products (9.7%) and Manufacturing (9.5%) led. That is the highest share of revenue, not the most dollars.
How much should a local business spend on marketing?
This article is about what surveyed companies reported, not what you should spend. For a way to set your own budget, see how much a small business should spend on marketing.
Do B2B companies spend less than B2C?
Not across the board. In The CMO Survey’s 2026 data, B2C Product companies reported 12.0% of revenue and B2B Product companies reported 7.0%. On the services side, B2B Services (10.1%) spent more than B2C Services (7.2%).
Should a new business spend more than the benchmark?
Often, yes, because there is less existing demand, fewer reviews, and less organic traffic to lean on. Early stage companies usually cannot lean on market presence the way mature businesses can. Treat a higher share as a period with an end date, not a permanent level, and start from a conservative projected revenue figure if you do not have a full year of sales yet. I would not invent a startup percentage. Use the goal-based approach in the spend article.
A straight next step
If you want help reading these industry benchmarks against your market, book a discovery call. We will look at your current marketing costs, your competition, and the marketing activities that are actually worth doing. If a senior marketing lead on a part-time basis would help you set that plan, I explained what that role is in what is a fractional CMO. We tailor pricing on a strategy call, after the scope is clear. If we are not the right fit, I will tell you.
Sources
All figures in this article come from the sources below. I fetched each one on November 13, 2026. Dates are the publish or update dates on those pages, or the file metadata where a visible date was the only stamp. Industry and business-model percentages from The CMO Survey are means, rounded to one decimal in the tables. Exact means and sample sizes are listed here. I did not invent or extrapolate any number. Where a source reports a sector or company type, I used that source’s exact label.
-
Gartner, “Gartner 2026 CMO Spend Survey Finds CMOs Allocate 15.3% of Marketing Budgets to AI, But Only 30% Are Ready to Scale AI Capabilities.” Press release dated May 11, 2026 (
datePublishedMay 11, 2026;dateModifiedAugust 13, 2026). Marketing budgets 7.8% of company revenue in 2026, up from 7.7% in 2025. Survey conducted January through March 2026 among 401 CMOs and other marketing leaders in North America, the United Kingdom, and Europe, with the vast majority reporting annual revenue over $1 billion. AI-ready marketing organizations reported average marketing budgets of 8.9% of company revenue and allocated 21.3% of marketing budgets to AI, versus the survey average of 15.3%. https://www.gartner.com/en/newsroom/press-releases/2026-05-11-gartner-2026-cmo-spend-survey-finds-cmos-allocate-15-point-3-percent-of-marketing-budgets-to-ai-but-only-30-percent-are-ready-to-scale-ai-capabilities -
Gartner, “CMO Spend in 2026: Redefining Marketing Investment Under Constraint,” Ewan McIntyre and Rachel Dooley, June 25, 2026 (
dateModifiedJune 25, 2026). Repeats the 7.8% average, states it is 18% lower than the mean of four years earlier, and states that marketing budgets increased by 1.3% since 2025. Paid media is 31.4% of 2026 marketing budgets. 15.3% of budgets allocated to AI. https://www.gartner.com/en/articles/cmo-spend -
Gartner, “Gartner 2025 CMO Spend Survey Reveals Marketing Budgets Have Flatlined at 7.7% of Overall Company Revenue.” Press release dated May 12, 2025 (
datePublishedMay 12, 2025;dateModifiedApril 30, 2026). Survey conducted February through March 2025 among 402 CMOs and other marketing leaders, vast majority over $1 billion in revenue. Paid media 30.6% of marketing budgets, or 2.4% of company revenue. https://www.gartner.com/en/newsroom/press-releases/2025-05-12-gartner-2025-cmo-spend-survey-reveals-marketing-budgets-have-flatlined-at-seven-percent-of-overall-company-revenue -
Gartner, The Chief Marketing Officer journal, 3Q 2025. PDF created July 16, 2025. “Insights From the 2025 Gartner CMO Spend Survey.” Figure 1: mean marketing budget 7.7% of company revenue in 2025 (n=402). Figure 2: 25th percentile 4.0%, median 6.0%, mean 7.7%, 75th percentile 10.5%. Highest quartile at 10.5% or more. Figure 3 (2025 means, n is the 2025 base): Consumer products 9.7% (n=43), Manufacturing 9.5% (n=52), Pharma 9.0% (n=32), Financial services 7.2% (n=50), Retail 7.1% (n=36), Insurance 7.5% (n=43), Media 8.0% (n=31), Healthcare 5.9% (n=42), Travel and hospitality 6.7% (n=37), IT and business services 5.8% (n=36). The figure also shows 2024 means for the same industries. Question: “What percentage of your revenue is being allocated to your total marketing expense budget in 2025?” https://emt.gartnerweb.com/ngw/globalassets/en/marketing/documents/cmo-journal-3q-2025.pdf
-
The CMO Survey, Highlights and Insights Report, 35th edition, 2026. Directed by Christine Moorman, Duke University’s Fuqua School of Business, co-sponsored by Deloitte and the American Marketing Association. PDF created April 15, 2026. Survey in the field January 7 to 29, 2026; 308 marketing leaders at for-profit U.S. companies (14.6% response from 2,111 invited), 97% VP-level or above. Marketing budgets 9.0% of company revenues and 9.6% of overall company budgets. Overall marketing spending grew 1.7% over the prior 12 months; digital marketing spending grew 8.2%. Social media spending 14.3% of budgets (projected 17.1% in one year; historical 12-month projections exceeded actuals by an average of 2.1 percentage points). Traditional advertising projected to decline 1.5% in the coming year. Acquisition budgets 26.0% larger than retention budgets, up from 19.6% one year earlier; 82.0% of respondents spent more on acquisition than on retention. Customer retention performance growth 12.8%, customer acquisition 7.4%, brand value 10.0%. Economic-sector means (rounded): B2B Product 7.0% of revenues, B2B Services 10.1%, B2C Product 12.0%, B2C Services 7.2%. https://cmosurvey.org/cmosurvey_results/The_CMO_Survey-Highlights_and_Insights_Report-2026.pdf
-
The CMO Survey, Topline Report, 2026. Marketing expenses as a percent of company revenues: mean 8.96%, median 5, standard deviation 11.45, 95% confidence interval 7.15 to 10.76, 154 valid cases (50.0% of 308). Marketing expenses as a percent of the company’s overall budget: mean 9.64%, median 7, 146 valid cases. https://cmosurvey.org/cmosurvey_results/The_CMO_Survey-Topline_Report-2026.pdf
-
The CMO Survey, Firm and Industry Breakout Report, 2026. PDF created March 30, 2026 (metadata modified March 30, 2026). Exact means for “Marketing expenses account for what percent of your company’s revenues?”:
- Total: mean 8.96%, n=154, SD 11.45.
- Primary economic sector: B2B Product 7.02% (n=61, SD 10.08); B2B Services 10.07% (n=41, SD 13.38); B2C Product 11.99% (n=34, SD 12.40); B2C Services 7.24% (n=18, SD 7.99).
- Industry sector: Banking / Finance / Insurance 7.43% (n=21, SD 11.37); Communications / Media 18.00% (n=6, SD 19.53); Consumer Packaged Goods 11.53% (n=15, SD 12.65); Consumer Services 11.00% (n=3, SD 5.57); Education 18.40% (n=5, SD 19.31); Energy 7.13% (n=4, SD 11.99); Healthcare 5.88% (n=17, SD 8.36); Pharma / Biotech 6.80% (n=5, SD 4.82); Manufacturing 5.64% (n=13, SD 11.90); Mining / Construction 0.35% (n=3, SD 0.56); Professional Services 6.84% (n=12, SD 9.37); Real Estate 12.55% (n=4, SD 12.52); Tech / Software / Platform 10.56% (n=33, SD 10.50); Transportation 3.83% (n=3, SD 5.35); Retail / Wholesale 8.80% (n=10, SD 12.84).
- Sales revenue bands: under $10 million, 13.34% (n=20); $10 million to $25 million, 17.40% (n=15); $26 million to $99 million, 11.14% (n=18); $100 million to $499 million, 5.86% (n=34); $500 million to $999 million, 6.86% (n=17); $1 billion to $9.9 billion, 5.70% (n=33); $10 billion+, 9.45% (n=15).
https://cmosurvey.org/cmosurvey_results/The_CMO_Survey-Firm_and_Industry_Breakout_Report-2026.pdf
-
Duke University Fuqua School of Business, “CMOs Face Headwinds Even as Marketing Value and AI Impact Grow,” March 31, 2026. Summary of the 35th edition of The CMO Survey: field dates January 7 to 29, 2026; 308 marketing leaders at for-profit U.S. companies; marketing budgets 9.0% of company revenues and 9.6% of overall budgets; overall spending growth 1.7%. https://www.fuqua.duke.edu/duke-fuqua-insights/CMOs-Face-Headwinds-Even-as-Marketing-Value-and-AI-impact-grow