


"How much should I spend on marketing?" is one of the most common questions business owners ask us, and it rarely gets a straight answer. Without one, you're left guessing how much to spend, where to spend it and what it should bring back.
This free planner gives you the answer for your business. It's the Google Sheet Chantz walks through in the video above. Fill in a handful of numbers in five to ten minutes and it builds your marketing budget for the next 12 months. It comes with our 9-page 2026 benchmark report on what businesses actually spend on marketing, so you can check your number against your industry.
What's inside
- The budget planner (Google Sheet). Make a copy, enter your numbers and the formulas build your revenue mix, revenue goal, percent of gross revenue, seasonality and month-by-month budget.
- Cost per lead benchmarks. A dropdown of starting cost per lead figures by industry that you can adjust for your market.
- The 2026 benchmark report (PDF). Marketing spend as a percent of revenue by year, business model, company size, industry and growth stage, plus what small businesses actually plan to spend.
It works for service businesses, e-commerce and retail. The walkthrough is built around a service business, so if you sell online, average order value takes the place of average job value.
The five steps
The planner follows five steps, one per tab:
- Know your revenue mix: where your revenue comes from and how much of it is new business.
- Set a real revenue goal you can check with math.
- Pick the percent of gross revenue you'll put into marketing.
- Bend the budget around your busy and slow seasons.
- Map it out month by month, so you always know what you're spending and why.
To make it concrete, the video runs every step for a made-up excavation company. Last year it did $1.2 million in revenue. About 75% came from builders and general contractors it has worked with for years, and 25% from homeowners (driveways, grading and foundation digs). Its average job is about $5,000, and its busy season runs from April through August. Open the sheet and follow along with your own numbers.
Before you start: enter your numbers
The first tab asks for only a few numbers:
- When the plan starts. In the example, January 1, 2027.
- Last year's total revenue. An estimate is fine. The example uses $1.2 million.
- Next year's revenue goal. The example aims for $1.6 million.
- What you spend on marketing now. The example spends a flat $2,000 a month, which is $24,000 a year, or 2% of last year's revenue.
- Average revenue per customer or sale. $5,000 in the example.
- Lead to customer close rate. Of every lead that comes in, how many do you close? The example uses 40%.
- Share of new sales from paid advertising. The example uses 80%.
From there the sheet shows your revenue gap. Going from $1.2 million to $1.6 million leaves a $400,000 gap, which is 33% growth. If everything stays the same as last year, revenue stays at $1.2 million. Something has to change.
If you don't know your close rate, start tracking it now. It's one of the most important numbers in this plan. Until you have it, use a standard figure for your industry and adjust it once you see what your team actually closes.
A word on goals: 33% growth is doable for a business this size when marketing and operations are dialed in, and it may still be too aggressive for yours. Jumping from $1.2 million to $3 million is 150% growth. That is a massive change to the business, and it needs real planning with your team before you commit to it.
Step 1: Check your revenue mix
Before you set the budget, look at where your revenue comes from. A common planning benchmark for a healthy business is about 60% from existing customers, repeat business and referrals, and 40% from new customers. Every industry is a little different, so treat it as a guide, not a rule.
- Too little new business (80/20 or 90/10). This usually means growth has hit a ceiling. Look at your marketing first: are you marketing at all, and is it all aimed at people who already know you? Moving closer to 40% new business opens up more revenue. Some industries with long sales cycles, like real estate, naturally lean on referrals.
- Too much new business (70% new, 30% existing). This is common for new businesses, but it's hard to sustain because new customers are the most expensive to win. Plan how you'll grow repeat business, lifetime value and referrals. Check that customers come back and that you could add a recurring service.
In the example, the excavation company gets about 80% of its revenue from existing customers and 20% from new ones. It sets a target mix of 70/30, because jumping straight to 40% new business isn't realistic. That means about $320,000 of the $400,000 gap needs to come from marketing, and the rest from the business's natural growth.
Step 2: Work back from your goal
The revenue goals tab turns the gap into customers, leads and dollars. Pick your industry from the dropdown to load a benchmark cost per lead. Costs change by location and competition, so adjust it if you know your own figure. The example company is in a competitive, high cost area, so it raises its cost per lead to $110.
Then the sheet does the math:
- $400,000 ÷ $5,000 average job = 80 new customers needed in the year.
- 80 customers at a 40% close rate = 200 leads.
- At $110 per lead, with 80% of new sales coming from paid advertising, that's about $17,000 a year just to generate the leads.
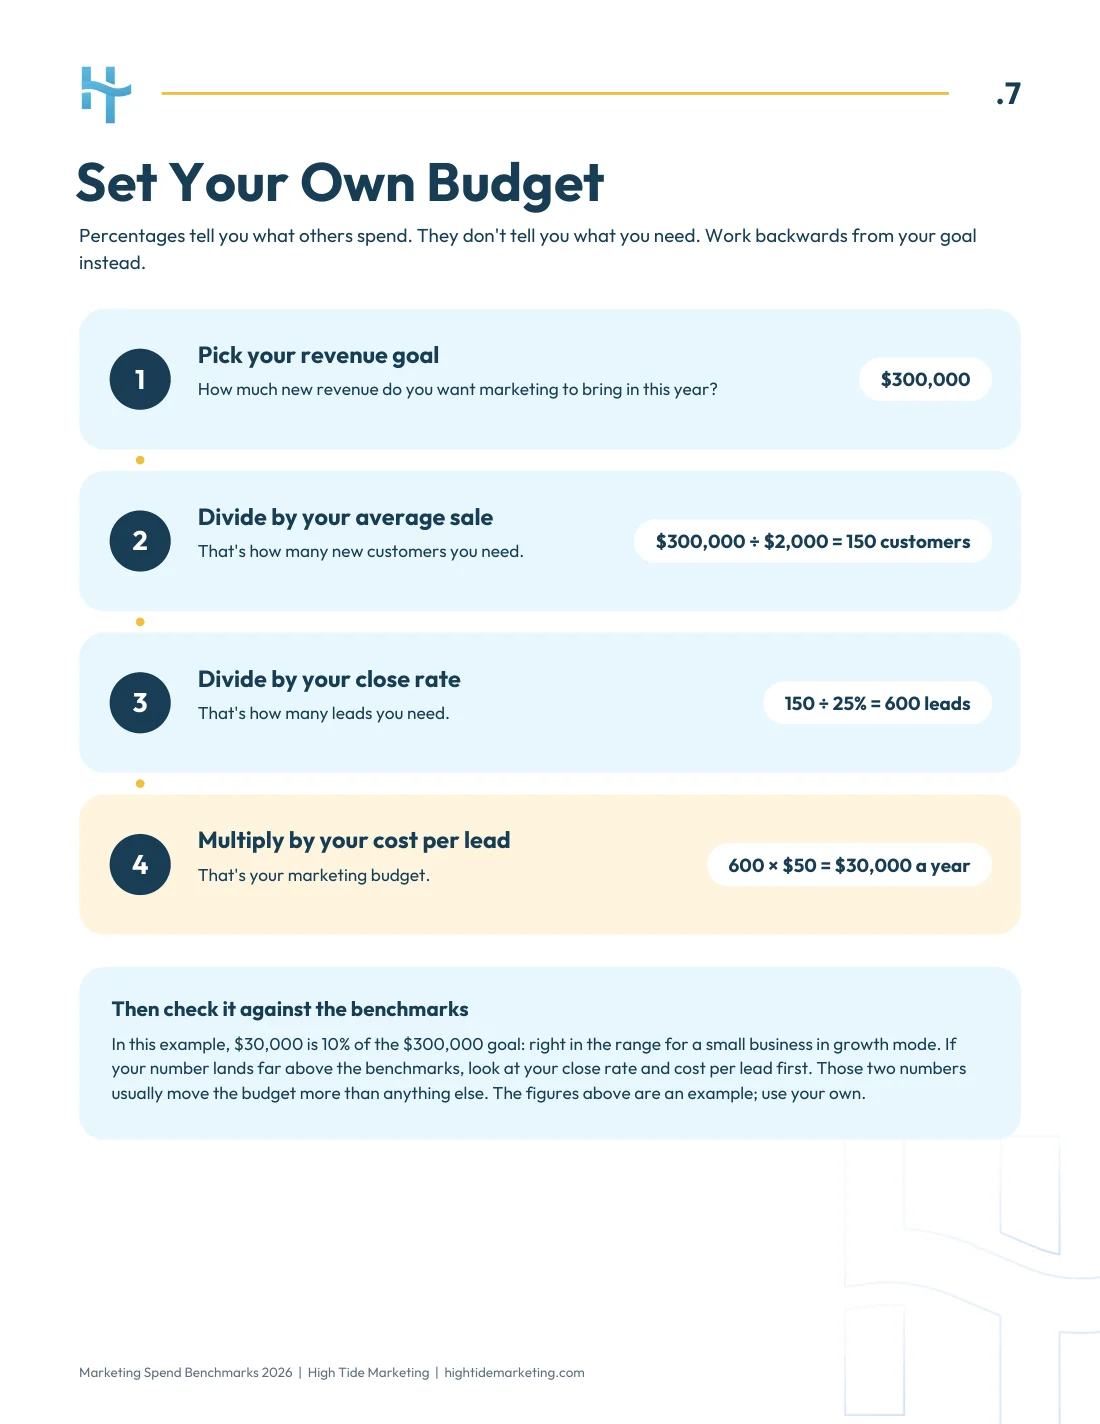
That $17,000 is the floor. It assumes your close rate holds and pays only for the leads themselves, not for the brand building that warms people up before they reach out. Page 7 of the report runs the same method on a different example: a $300,000 goal, a $2,000 average sale, a 25% close rate and a $50 cost per lead comes to $30,000 a year.
Step 3: Pick your percent of revenue
Next, set marketing as a percent of your target revenue. The example company has spent 2%, and it knows it needs at least $17,000 for leads, so it moves to 4% of its $1.6 million goal. That's $64,000 for the year, $40,000 more than last year, or a little over $5,000 a month.
That's a big step for an owner used to spending 2%. Broken down by month, it's easier to see where the money goes and decide whether you're comfortable with it.
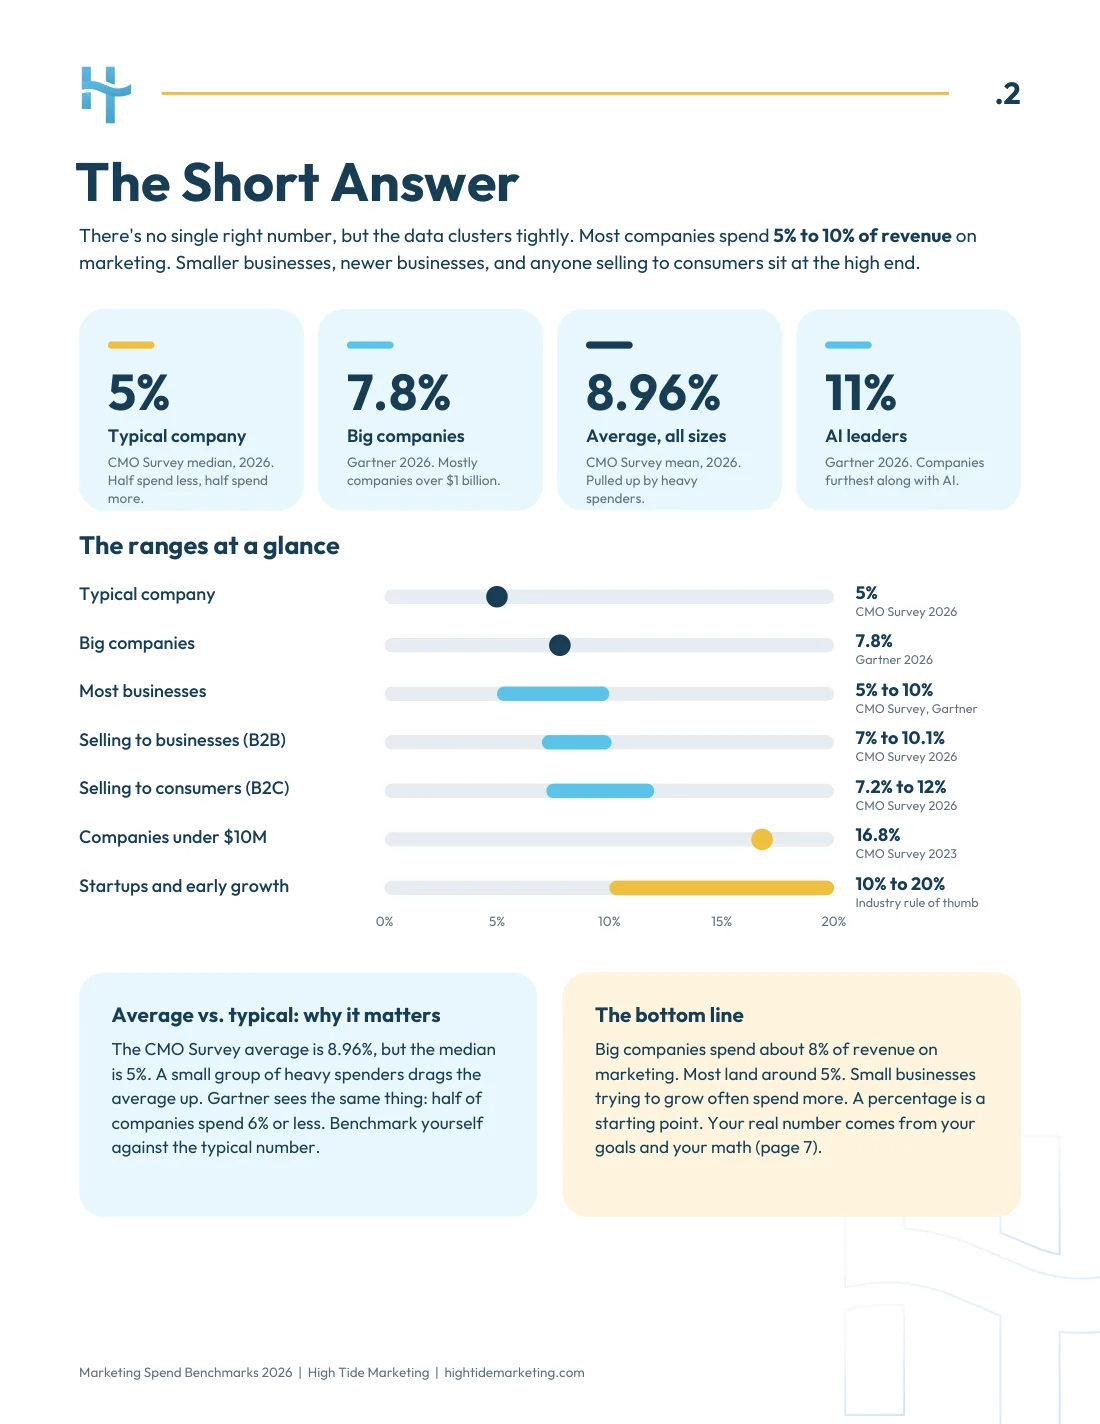
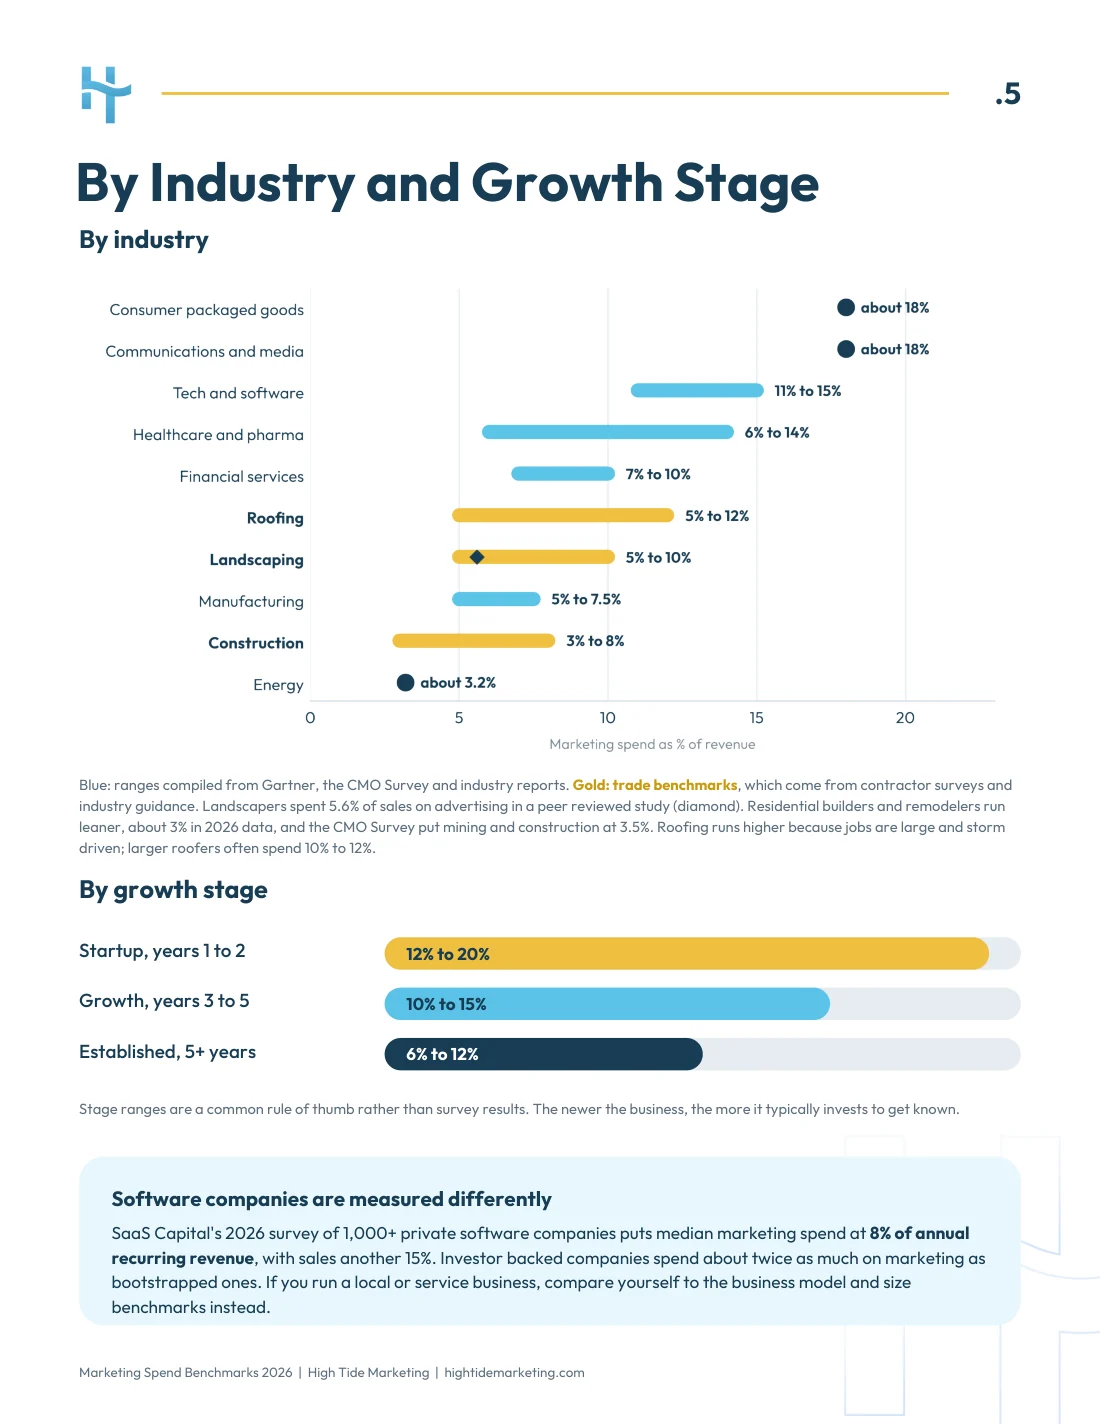
How do you know what's too much or not enough? That's what the benchmark report is for. It pulls together the latest surveys in one place, and most businesses spend between 5% and 10% of revenue on marketing. A few figures from the report:
- 5% is the median for a typical company (The CMO Survey, 2026).
- 7.8% is the average for big companies, mostly over $1 billion in revenue (Gartner, 2026).
- 16.8% is what companies under $10 million spent (The CMO Survey, March 2023).
- 3% to 8% is the typical range for construction, based on contractor industry guidance.
At 4%, the excavation company sits at the lower end of the construction range, which is a realistic place to start. The sheet also keeps quick benchmark notes on the right side, so you don't have to open the report every time.
The sheet also splits your budget into lead generation and brand. In the example, the minimum needed for paid leads is about 1.1% of revenue, which leaves 2.9% to grow the brand. Marketing isn't only lead generation. When more people know and search for your business, you get more clicks and your cost per lead can come down.
Step 4: Plan around your seasons
Most people skip seasonality, and it matters. Spending the same amount every month ignores when your customers are actually buying.
On the seasonality tab, mark your peak months and your slow months. The excavation company marks April through August as peak and September through December as slow. The sheet then weights each month: peak months carry about 12% of the annual revenue goal each, and slower months drop toward 5%. Monthly revenue targets run from about $90,000 in slow months up to about $190,000 at the peak.
These weights get you in the ballpark. If you have last year's monthly revenue, enter it and compare. If April did $110,000 last year, a $193,000 target this April is too big a jump, so adjust the numbers until each month feels realistic.
The sheet then sets the spend for each month. The effective marketing percent sits around 4.1% in slower months and dips to about 3.9% in April through June, because those revenue targets are higher. A lower percent of a bigger number still means more dollars. In the example, monthly spend starts around $3,700 in the first three months and ramps up to about $7,500 at the peak.
Step 5: Your month-by-month budget
The last tab is the monthly budget map, and it's all formulas. You don't enter anything. It shows last year's revenue, next year's target, the growth needed, the new customers required, the share coming from paid ads and your paid acquisition cost each month.
Take it to your team and decide where the money will go and whether the plan is realistic. If a number looks off, go back and change it. Raise the percent from 4% to 5% and every monthly budget updates. We also suggest adding columns for your operational numbers, like average job value and close rate. That way you see the full funnel in one place and can spot where the bottlenecks are.
For the example company, the plan comes to 4% of a $1.6 million goal, about $5,300 a month. That's more than double last year's spend, weighted toward April through August. That's not a guess. It's a plan you can make decisions from.
It's also better to learn on a spreadsheet that a goal doesn't work than to find out six months into the year. The math may also show your team could have aimed higher.
What the budget doesn't tell you
Now you know how much to spend. You don't yet know where it belongs. Two companies can spend the same $5,300 a month, and one books six jobs while the other books none and wonders why it spent money on marketing at all. The difference is the channel, not the budget, and that's what we'll cover next.
If you want help choosing your channels or checking your numbers, book a free discovery call with Chantz and the team.